
Multiple Threads of Execution & Process Utilization in Linux
This is the seventh blog of Linux Masterclass Series.


Until now, we have seen that everything in Linux runs on processes. These processes take some resources to execute, like the memory and CPU Time. We will talk about how the processes utilize these resources behind the scenes and the logging that system does.
Resource Utilization by Processes
Earlier, while talking about processes, we came across a command known as ‘top’. top is similar to ‘ps aux’ but rather than giving us a snapshot of the resource utilization by the processes, it shows us a live version where it keeps updating the details after every 3-5 seconds.
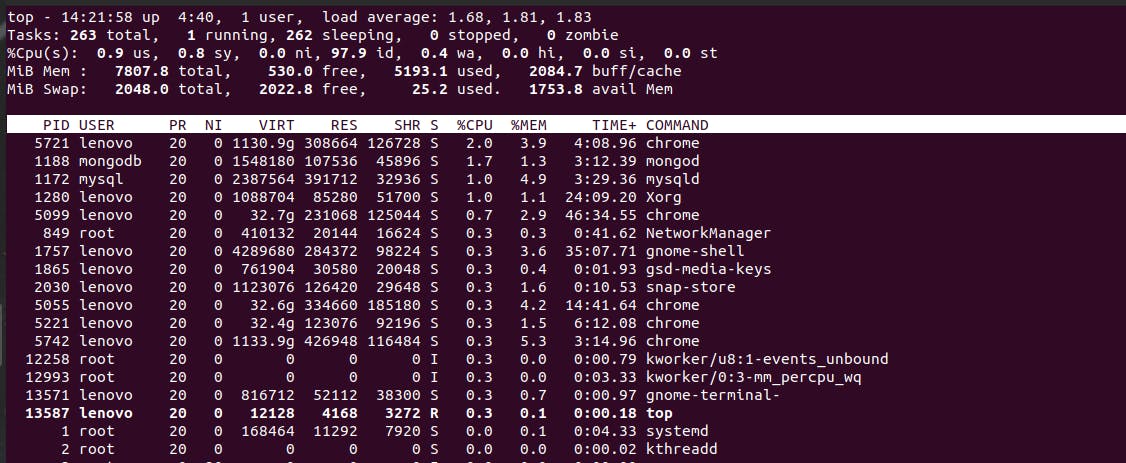
Earlier, we only understood the columns and the data in the rows but left the part above it. Let us go through the key-value pairs.
top – 14:21:58 tells us the current time. up 4:40 means the system has been running for 4 hours 40 minutes. 1 user means only one user is currently logged in the system. load average tells how much load the system is taking in form of averages (We will discuss this later in more detail).
The Tasks section tells us that a total of 263 tasks exist. Out of which 1 is running, 262 are sleeping, 0 stopped, and 0 are zombie.
In the %Cpu(s) section, 0.9us means the percentage of CPU time used by the processes that are not nice (Understand the concept of ‘Nice’ here). 0.8 sy is for the processes run by the system or Kernel itself. 0.0 ni is for the processes that are nice or have nice value. 97.9 id is the percentage of CPU Time that is idle.
Our CPU/Kernel is always looking for the input/output processes in the system executed by the user. CPU allocates a separate waiting time to catch and process these input requests. So, 0.4 wa is the percentage of time currently invested by the CPU in waiting for input/output streams.
It may happen that sometimes we interrupt a software or a hardware device interrupts some process. The CPU has to listen to these as well. 0.0 hi, 0.0 si tells us the amount of CPU time going into Hardware interrupts and Software interrupts.
0.0 st tells us the amount of time something is stealing out of the Operating System. It can be some other OS like Windows on the same machine if you have installed one.MiB mem is for memory utilization, and MiB swap is for Swap Memory utilization. The value numbers are in megabytes.
Checking Resource Utilization by a Single Process
Maybe, you want to monitor just one process. It can be because the process is slowing down your system,
There may come a situation where a process is slowing down your system, like Google Chrome, after keeping too many tabs open. And you want to monitor that particular process that we suspect might be slowing down our system.
Run the command top –p [PID] where –p stands for PID. You can find the PID of a running process from the first column of the top command data.
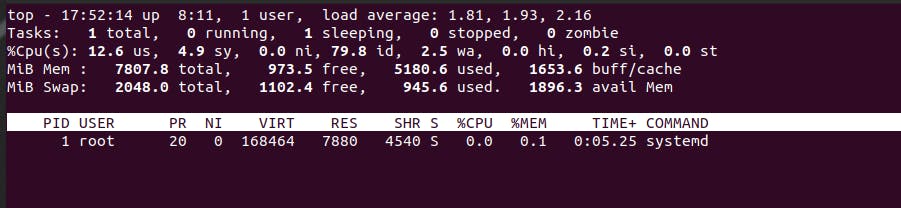
Here you can see the result of the top –p 1 command. It shows us the details of the mother process.
List of Files (lsof)
Let us imagine a scenario where you plug in the USB in your computer and open a code file directly from the USB via VSCode. Or maybe, you opened a movie via VLC Media Player directly from the USB. Now, after closing everything that you opened directly from the pen drive, if you try to right-click and ‘eject’ the USB, it sometimes may say something like, the device is currently in use. You cannot eject it. That too after closing VSCode and VLC Media Player.
It means there is a file inside the pen drive folder that might be getting used by a process in the system.
Everything is a Process. In this context, even the VSCode and VLC Media Player are Processes.
There is a command lsof to know what files are currently in use by a Process. ls means list, o means of, and f means files. It gives us a list of all the files currently in use with the associated process.
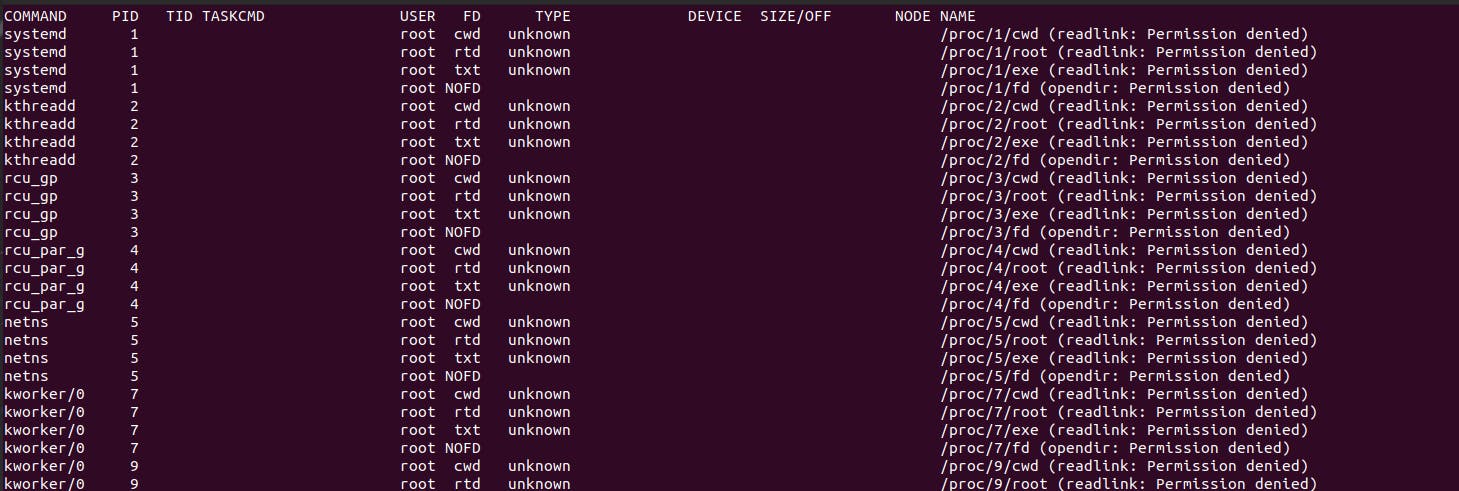
It will help you find out why you cannot eject a particular device by letting you know what process is utilizing a file of your device. Now you can kill that process with the kill command using its PID.
Multiple Threads of Execution
Let us assume you are playing a car-racing multiplayer game. There are two cars. You are controlling car 1 and the other player, car 2. Wherever you two are sitting in the world, your movements will get reflected in each other’s screen. If the other player moves his car left/right, you will see it on your screen.
Two things are happening in your system while you play the multiplayer game on your computer:
- The position of the player is updated.
- The position of the player is sent to the internet.
It proves that the Kernel provides multiple ways of execution in the same program. Let us take one more example to understand this better.
Let us assume you are writing code in some editor, and it is automatically getting saved. So, two things are happening here.
- Code Editing
- Auto-saving
As we know, all software are processes. Let us understand this above concept in those terms. Now the process has one piece of code that is doing one thing. It can be updating your position in the game based on keyboard input or editing the code written by you. The other piece of code in the process is doing some other thing. It can be sending your changed position to the server so the other player can receive it or auto-saving your written code in the code editor.
These two ‘things’ that the process is executing parallelly are called ‘multiple threads of execution’ and are also known as ‘Lightweight Processes’.
There is a way to check all the processes running along with their threads by running the command ps m.
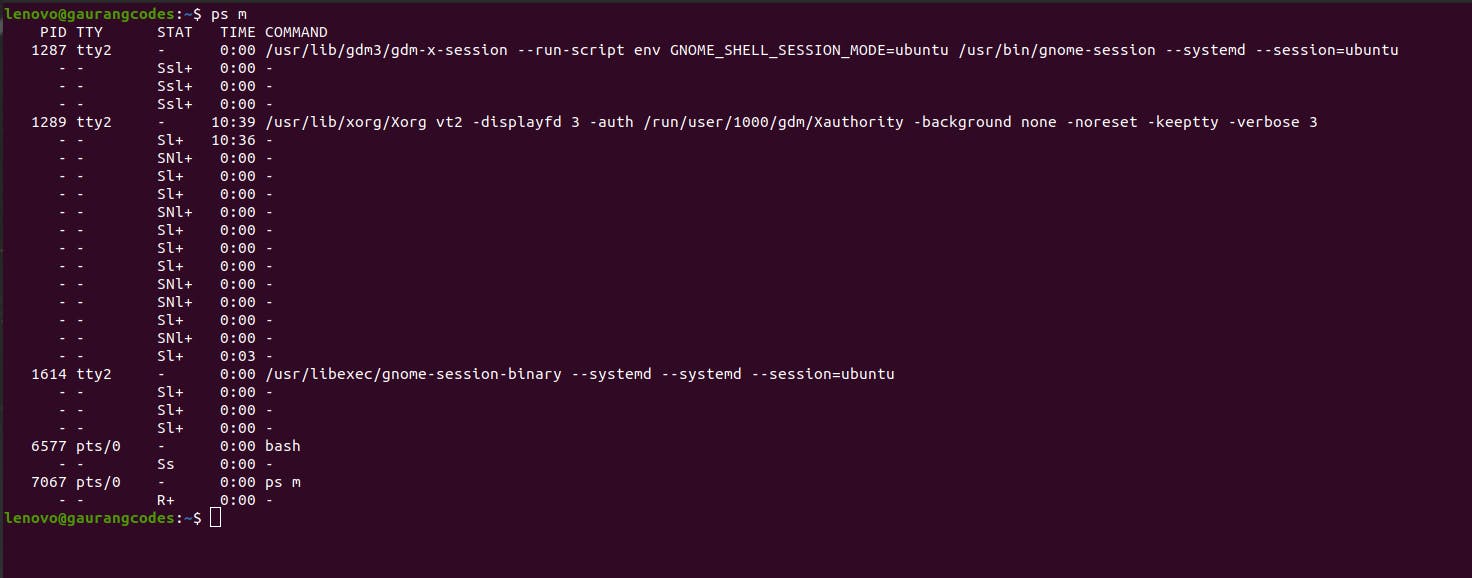
The threads with - in PID and TTY columns are threads. As the bash and ps m processes only have one thread of execution, there is only one line of - or thread under them.
Load Averages
Run the command uptime
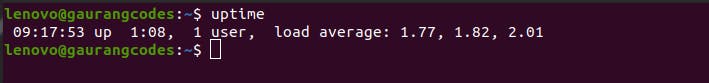
It is the same as the first line of the top command output. Earlier, we left Load Averages for later. Let us understand them now.

Load Average is a good way of observing the load on the CPU. These three numbers mean how much the load average is on your CPU at the interval of 1 minute, 5 minutes, and 15 minutes.
What does the CPU load mean? It means the average number of processes waiting to be executed by the CPU.
Let us say you have a 1-core CPU. Assume it is like a single-lane road. It is busy during rush hour, and the lane is running at full capacity, so the load average is 1. If the traffic gets double what the road can handle at once, the load average will be 2. If the lane can handle 10 cars at once, but only five cars are there, the load average will be 0.5.
If the CPU load average is 1, it does not mean the CPU is slow. Because all CPUs today do not come with a single-core CPU (Understand the concept of cores and CPU Time in detail here).
If your CPU has 4 cores (quad-core), it is like having 4 road lanes. And now, if the CPU load is 1, then it means the CPU is only using 25% of its capacity.
vmstat command
By running the command vmstat, you can see a detailed version of how much memory your system is utilizing right now.
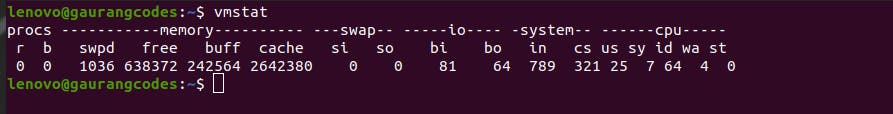
Let us go through the output.
procs section
r- processes at runtime.b- processes at uninterruptible sleep.
memory section
swpd- how much swap memory we have.free- free memory we havebuff- memory for buffercache- memory for caching
swap section
si- memory swapped in the diskso- memory swapped out of the disk
io section
bi- blocks received from a block devicebo- blocks sent out to a block device
system section
in- number of interrupts per secondcs- how many context switches are there, which means how many processes it is giving time to per second
cpu section
us- time, given to the usersy- time, given to the systemid- idle timewa- waiting time for input/output streamsst- steal time
Logging
Various types of processes are running in your system, like Kernel processes, daemon processes, and mother process etc. All these processes are continuously doing something in our system. And all these events are saved in a human-readable format in files known as ‘logs’. This activity of process events getting saved in files is known as ‘logging’. The logging data gets saved in the ‘/var’ directory.
How are logs getting created?
This is done through a service known as ‘Syslog’. It collects all the information on whatever is happening in our system and sends it to the ‘system logger’. One of the most important components of the Syslog is a daemon process known as ‘syslogd’. This Syslog daemon waits for any event to happen and then tries to figure out what it needs to do with it. It might be possible that it needs to send the event information to a file or print that message into the console, or maybe it does not have to do anything like in the case of /dev/null (this file nullifies whatever output we send to it).
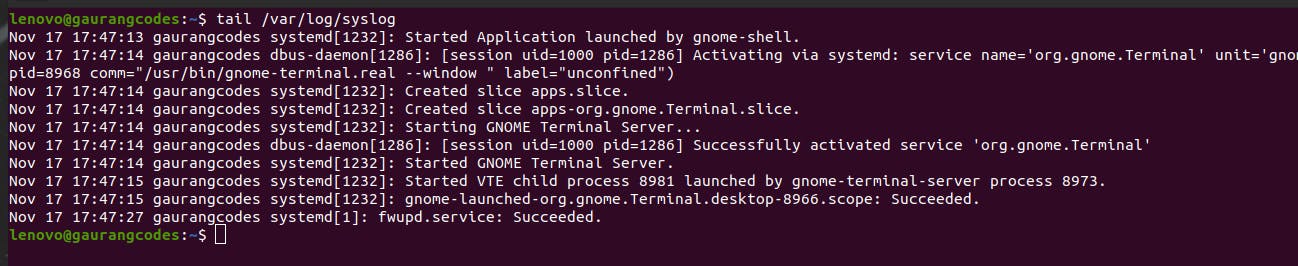
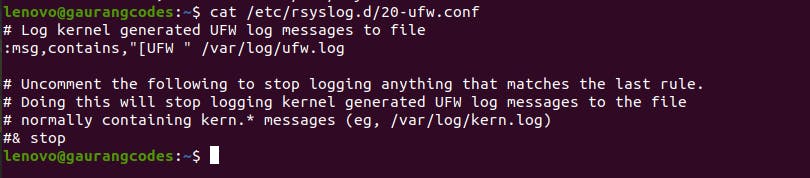
System logger stores all the log files inside /var/log/syslog. But this is not the only file maintained by the System logger. There are more, like ‘/etc/rsyslog.d’.
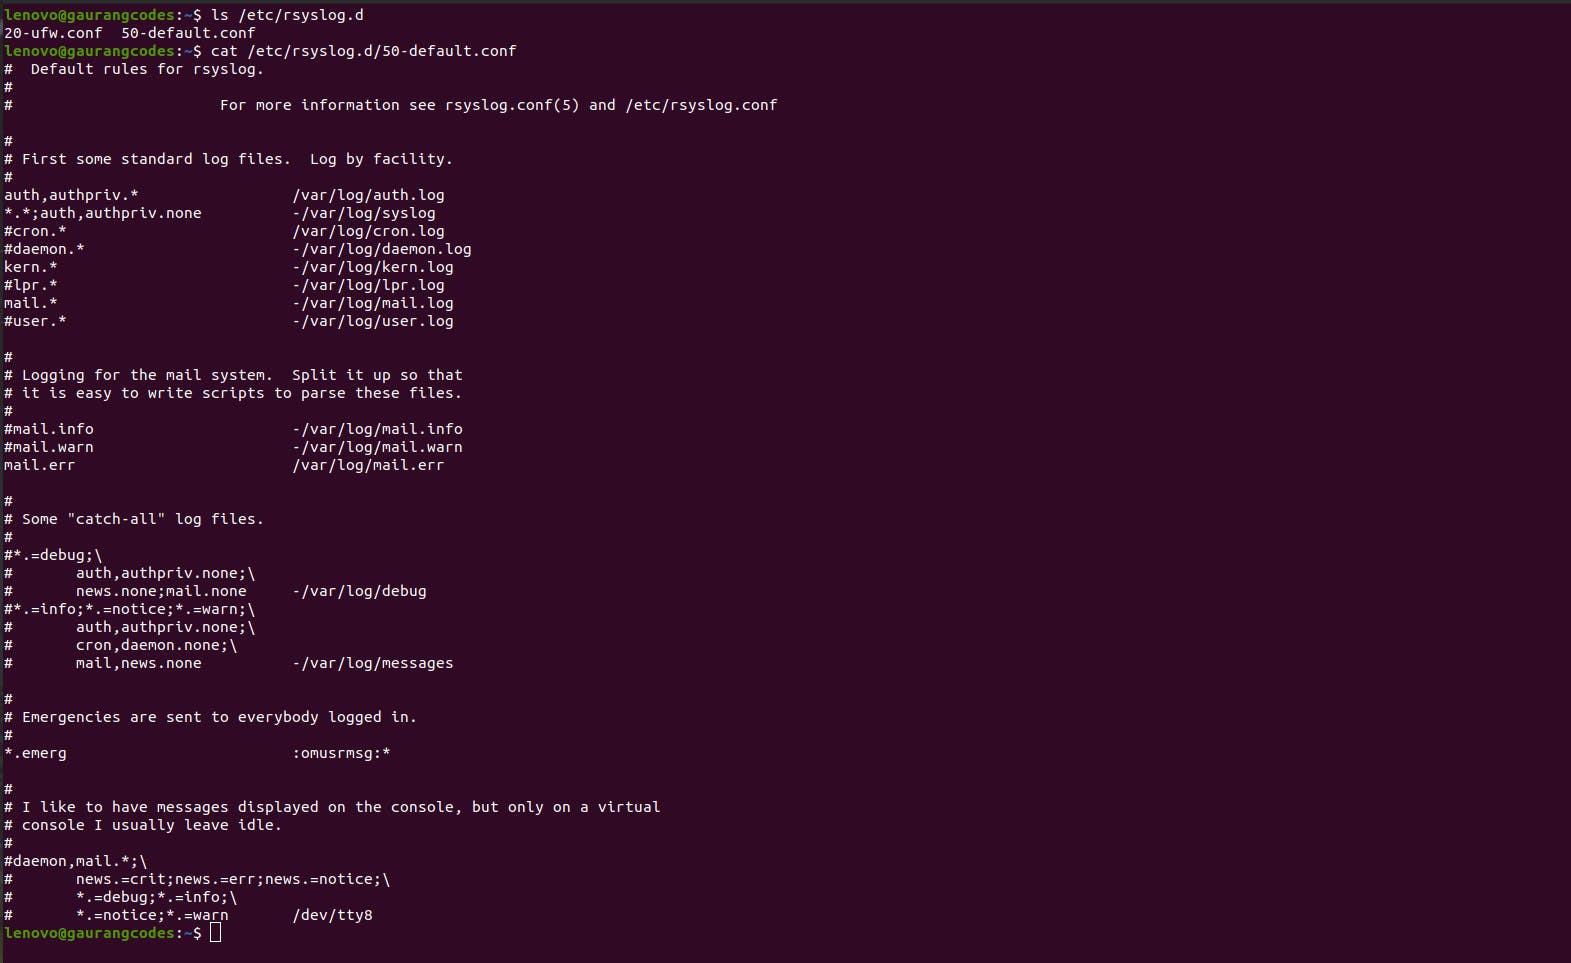
As you can see, there are files for kernel logs, mail logs, mail errors etc. And in the second file, it is maintaining /var/log/ufw.log.
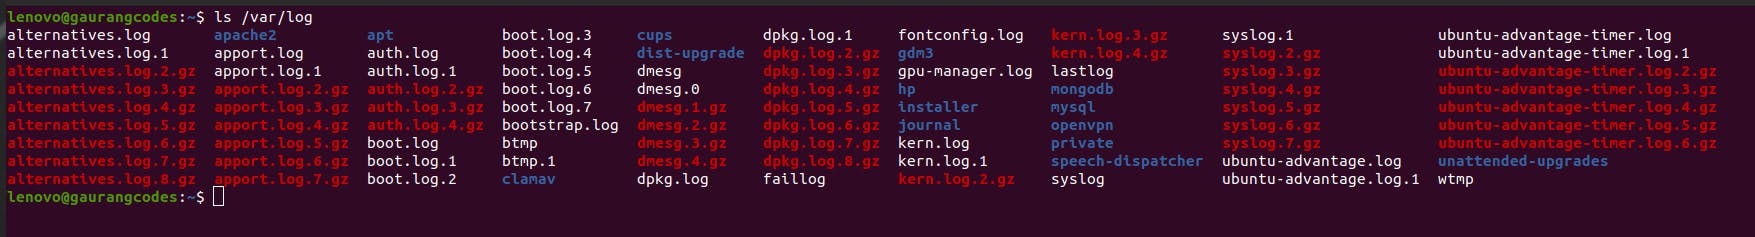
If you run ls /var/log, you can see the list of various maintained log files.
Logging Manual Messages
You can also send messages manually into your logs. Sometimes we may have done something we want to document in the logs. Or save some keywords inside so we know after which keyword we want to start searching in the logs. We have a command for this known as logger. If you run logger –s Hey my name is Gaurang Gaur
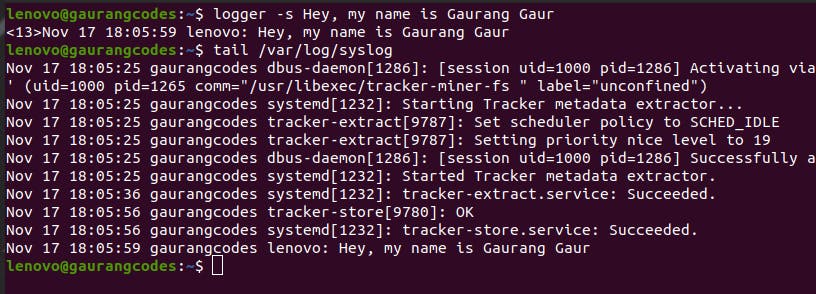
As you can see in the last line of the /var/log/syslog output, this message got stored as one of the log entries.
Log Management with logrotate
Logging also has to manage the disk space efficiently as the log files are taking so much data. And most of the time, we want to check the latest logs instead of the 3-month-old ones. All this management can be done through the ‘logrotate’ utility. It also has a config file where we can specify and configure things, like what logs we want to keep and how we want to compress our logs. The logrotate utility runs every day through ‘cron’ or cron jobs.
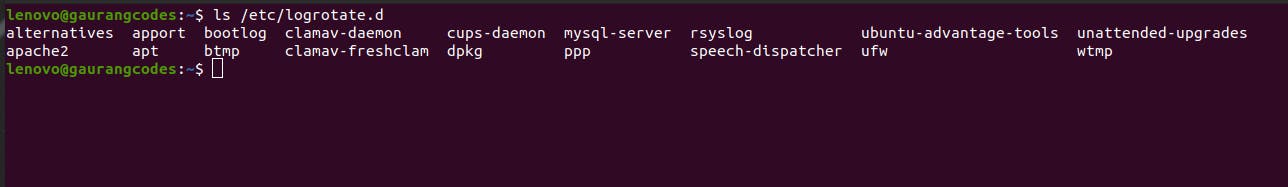
You can find logrotate in /etc/logrotate.d, where there is a list of various configs like bootlogs, syslogs, daemon processes etc.
Thanks for reading :)
To read the previous blogs of this Linux Series, go to blog.gauranggaur.com
To see the video lecture of this blog, go to this youtube video
Follow me on Twitter
Do comment your thoughts, questions or anything unique you learned below!